

S&P 500 Futures Find Strong Support at Fibonacci Level, Tech Stocks Weaker
ESU3
+0.27%
Add to/Remove from Watchlist
Add to Watchlist
Add Position
Position added successfully to:
Please name your holdings portfolio
Type:
BUY
SELL
Date:
Amount:
Price
Point Value:
Leverage:
1:1
1:10
1:25
1:50
1:100
1:200
1:400
1:500
1:1000
Commission:
Create New Watchlist
Create
Create a new holdings portfolio
Add
Create
+ Add another position
Close
AMZN
+0.10%
Add to/Remove from Watchlist
Add to Watchlist
Add Position
Position added successfully to:
Please name your holdings portfolio
Type:
BUY
SELL
Date:
Amount:
Price
Point Value:
Leverage:
1:1
1:10
1:25
1:50
1:100
1:200
1:400
1:500
1:1000
Commission:
Create New Watchlist
Create
Create a new holdings portfolio
Add
Create
+ Add another position
Close
META
-1.40%
Add to/Remove from Watchlist
Add to Watchlist
Add Position
Position added successfully to:
Please name your holdings portfolio
Type:
BUY
SELL
Date:
Amount:
Price
Point Value:
Leverage:
1:1
1:10
1:25
1:50
1:100
1:200
1:400
1:500
1:1000
Commission:
Create New Watchlist
Create
Create a new holdings portfolio
Add
Create
+ Add another position
Close
Good morning, everyone. So I guess yesterday was the one day in July that market goes down a teeny bit, eh? Looking at what the S&P 500 Futures have done this week, we can see that it found strong support at the major Fibonacci level (red arrow) and, in spite of a clean little topping pattern (rectangle), prices have zipped right back into that area, negating its value. Thus we’re back in mode.
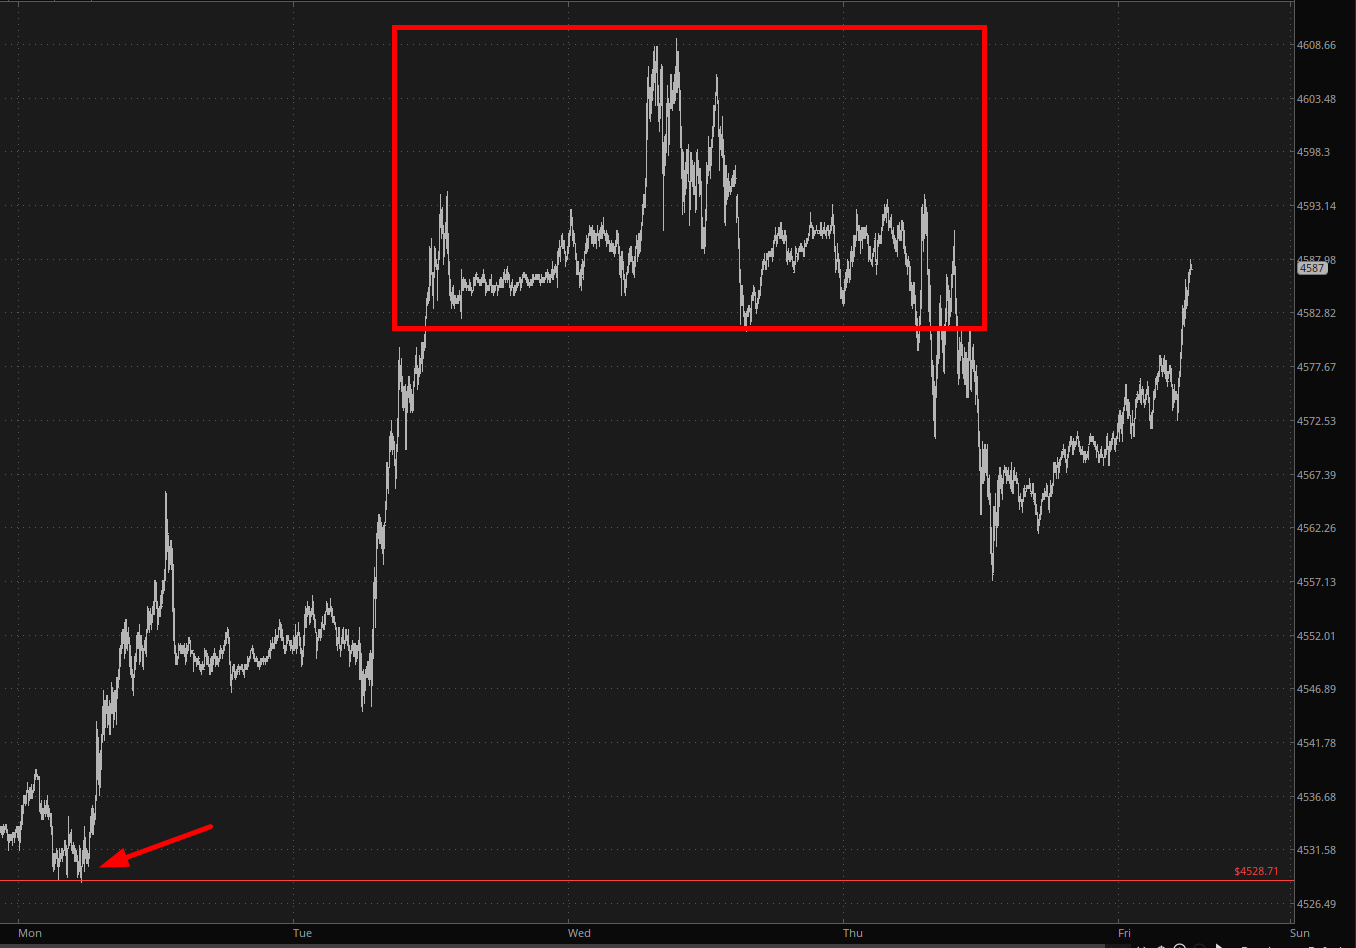 ES Chart
Tech stocks had their second worst day of the year yesterday (incredibly…….) and are, on the whole, weaker than the /ES for the week. I’ve got puts on two big tech stocks – Meta Platforms Inc (NASDAQ:META) and Amazon.com Inc (NASDAQ:AMZN) – which report earnings next week and the week after, respectively.
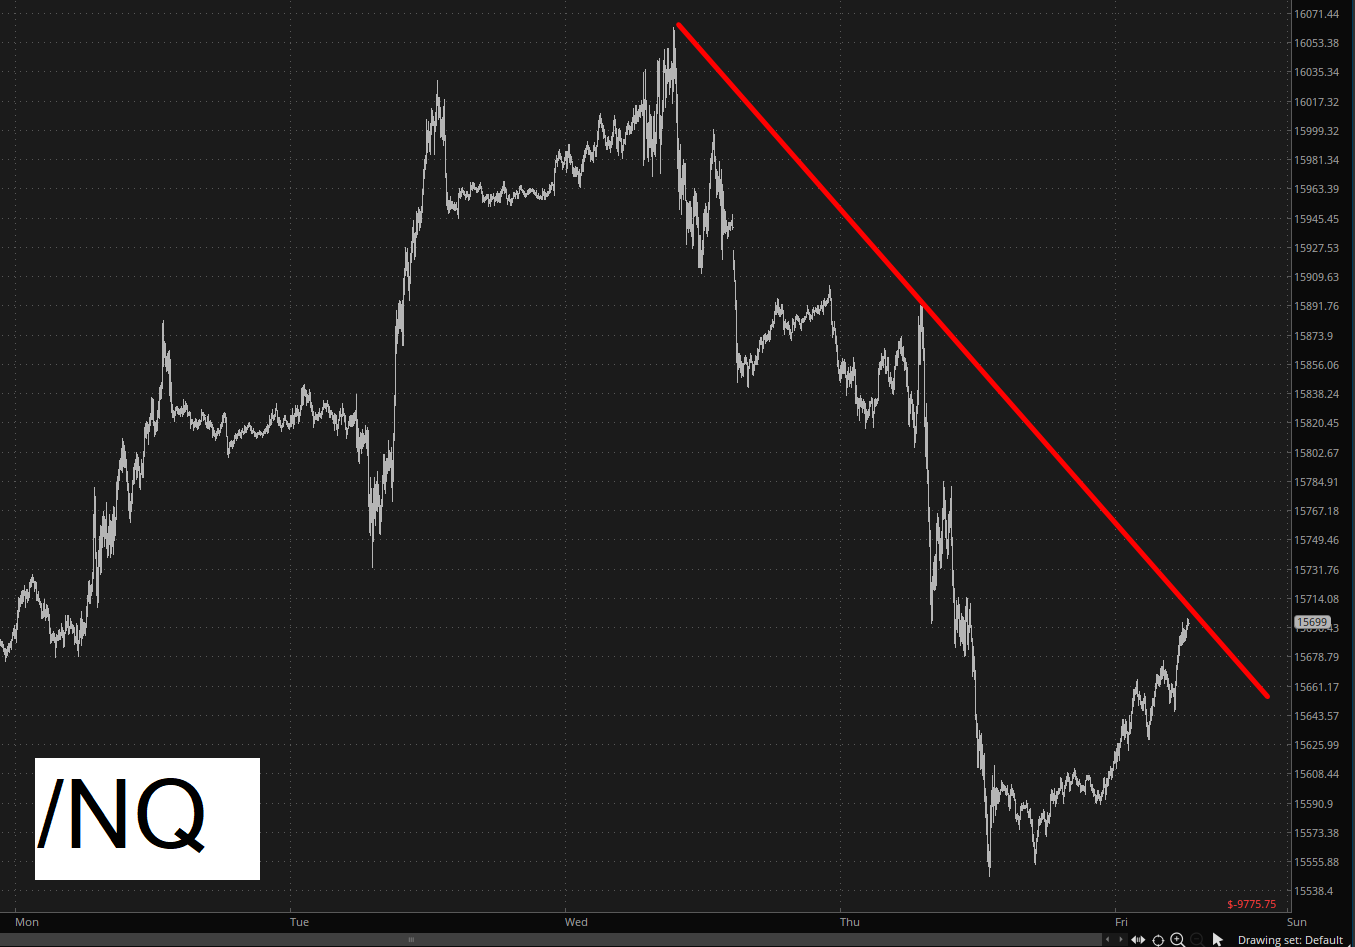 NQ Chart
At this point, I think I’ll just leash up the dogs and clear my mind. Good luck out there!


