

Natural Gas Crashes Into Historic 25-Year Price Support
NG
-1.51%
Add to/Remove from Watchlist
Add to Watchlist
Add Position
Position added successfully to:
Please name your holdings portfolio
Type:
BUY
SELL
Date:
Amount:
Price
Point Value:
Leverage:
1:1
1:10
1:25
1:50
1:100
1:200
1:400
1:500
1:1000
Commission:
Create New Watchlist
Create
Create a new holdings portfolio
Add
Create
+ Add another position
Close
It’s been a rough go for natural gas prices.
Even with elevated inflation numbers, natural gas is still in crash mode.
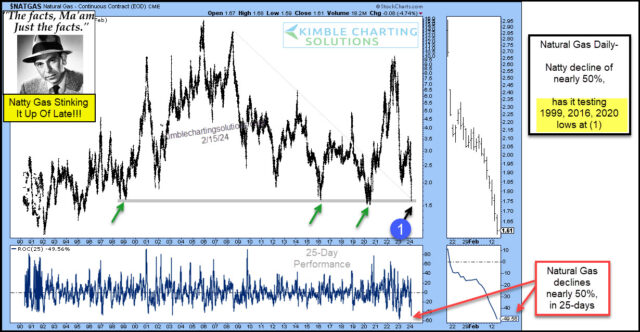 Natural Gas Daily Chart
Today’s Natural Gas chart highlights the crash in prices. Natty has fallen nearly 50 percent in just 25 days.
That is the 2nd largest 25-day decline in natural gas history.
And it is currently testing important lows, a support area that dates back 25-years (1999) at (1).
In my humble opinion, this is a critically important support test following a rare decline. Will Natural Gas bulls show up here? Stay tuned


