

Russell 2000 Primed for a Breakout; Nasdaq, S&P 500 Near Market ‘Extreme’ Tops
US500
+0.96%
Add to/Remove from Watchlist
Add to Watchlist
Add Position
Position added successfully to:
Please name your holdings portfolio
Type:
BUY
SELL
Date:
Amount:
Price
Point Value:
Leverage:
1:1
1:10
1:25
1:50
1:100
1:200
1:400
1:500
1:1000
Commission:
Create New Watchlist
Create
Create a new holdings portfolio
Add
Create
+ Add another position
Close
US2000
+2.33%
Add to/Remove from Watchlist
Add to Watchlist
Add Position
Position added successfully to:
Please name your holdings portfolio
Type:
BUY
SELL
Date:
Amount:
Price
Point Value:
Leverage:
1:1
1:10
1:25
1:50
1:100
1:200
1:400
1:500
1:1000
Commission:
Create New Watchlist
Create
Create a new holdings portfolio
Add
Create
+ Add another position
Close
IWM
+2.33%
Add to/Remove from Watchlist
Add to Watchlist
Add Position
Position added successfully to:
Please name your holdings portfolio
Type:
BUY
SELL
Date:
Amount:
Price
Point Value:
Leverage:
1:1
1:10
1:25
1:50
1:100
1:200
1:400
1:500
1:1000
Commission:
Create New Watchlist
Create
Create a new holdings portfolio
Add
Create
+ Add another position
Close
IXIC
+1.30%
Add to/Remove from Watchlist
Add to Watchlist
Add Position
Position added successfully to:
Please name your holdings portfolio
Type:
BUY
SELL
Date:
Amount:
Price
Point Value:
Leverage:
1:1
1:10
1:25
1:50
1:100
1:200
1:400
1:500
1:1000
Commission:
Create New Watchlist
Create
Create a new holdings portfolio
Add
Create
+ Add another position
Close
Friday left the Russell 2000 (IWM) primed for a breakout and Monday delivered on that setup. By the close of business, the Russell 2000 was left with a bullish “three white soldiers” setup and the potential for more upside.
So while the Nasdaq and S&P 500 are near market “extreme” tops, the Russell 2000 is still trading well within itself.
Technicals for the Russell 2000 ($IWM) are net bullish and improving, but Monday’s volume didn’t register as accumulation.
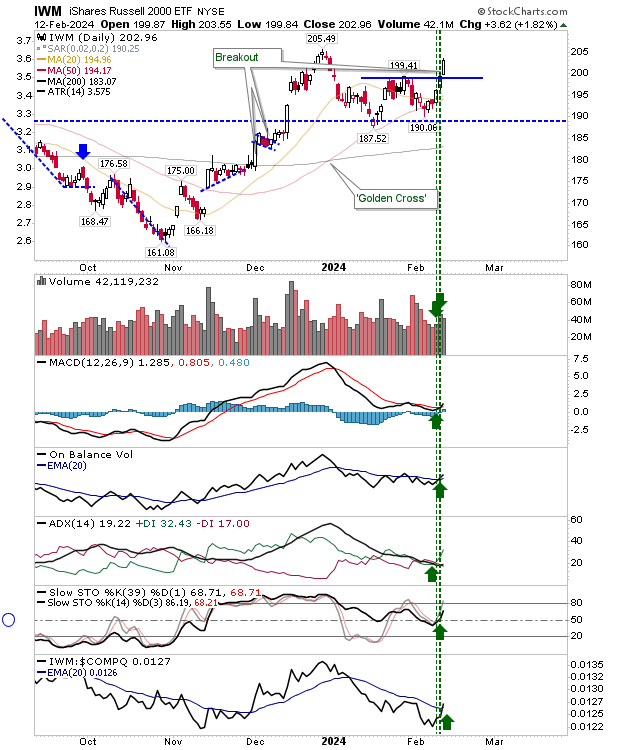 IWM-Daily Chart
The Nasdaq eased off its high, but the losses didn’t do a whole lot of technical damage.
It has been several months since the index last tested its 50-day MA, so if the selling was to continue then I would be looking at a test of this moving average.
COMPQ-Daily Chart
The S&P 500 finished with a doji like the Nasdaq. What applies to the Nasdaq also applies to the S&P 500.
SPX-Daily Chart
After yesterday’s action indices have shown their hand.
We have bearish doji in the Nasdaq and S&P 500 that should deliver lower prices in the coming days, but the Russell 2000 ($IWM) may pause today, but I would be looking for gains to resume.


